




























Product costing used to be a problem you could outrun. When ingredient prices climbed, you raised prices across the board, buried the imprecision in a higher invoice, and moved on. A wrong cost number did not matter much because a general price increase covered the leak and nobody noticed. That era is finished. Consumers are trading down. Retailers are pushing private label harder than ever. Broad price increases now cost you volume, not just goodwill. So the old escape hatch is closed, and what is left behind is this: most food and beverage manufacturers are carrying bad cost data, and at today’s prices, specific SKUs and specific customer accounts are already losing money. The problem is that you cannot see which ones.
Setting a price is the easy part. Any operator can pick a number. The hard part, the part that actually determines whether you make money, is knowing your true, current cost per SKU and per customer so you can tell which products and accounts are already underwater before you ship another case. That requires real operational data, captured at the plant level, updated as conditions change. Most manufacturers do not have it. Here is exactly why the number in your system is wrong, and what each error is quietly hiding from you.
Three Departments, Three Different Costs, Zero Consensus

Ask procurement what a product costs and you get the latest invoice price. Ask production and you get the standard cost baked into the system. Ask finance and you get a quarter-end average blended across a dozen batches. All three numbers are real. None of them is the truth.
This fragmentation is the first reason your cost data is unreliable. The figure you price against is usually whichever version someone pulled last, often weeks old, often an average that smooths over the actual variance in your most recent runs. You cannot identify which SKUs are underwater until the quarter closes and finance reconciles everything. By then, you have shipped thousands of units at a margin you were not actually earning.
Case in point: A mid-size sauce manufacturer runs three SKUs through the same line. Procurement updated ingredient costs two weeks ago after a new oil contract came in. Finance has not refreshed standards yet. Production is costing off last quarter’s sheet. All three groups believe their number is current. None of them is talking to the other. The product ships. The margin bleeds.
Stale Standards in a Market That Moves Every Month

Cocoa, edible oils, dairy, and energy do not wait for your annual standard cost review. They move monthly, sometimes weekly. Your system, however, carries a cost that was set weeks or months ago, and that lag is where your quoted margin and your real margin silently diverge.
A product you believe earns 30 percent gross margin might be earning 12 percent once you account for ingredient prices that have moved since the standard was last updated. You are not mismanaging the business. You are flying on instruments that stopped updating.
The hidden damage: You prioritize volume on a SKU you think is your strongest earner. You push the sales team to grow that account. You run overtime to fill the order. Every case shipped at that “30 percent margin” is actually earning 12, and the extra volume you chased just amplified the loss. This is not a pricing failure. It is a cost-visibility failure.
When raw material prices swing and your system does not update until the next scheduled review, you are making production and sales decisions based on a fiction. The margin looks strong. The bank account tells a different story at quarter-end.
Yield Variance: The Cost the Floor Knows and the System Ignores
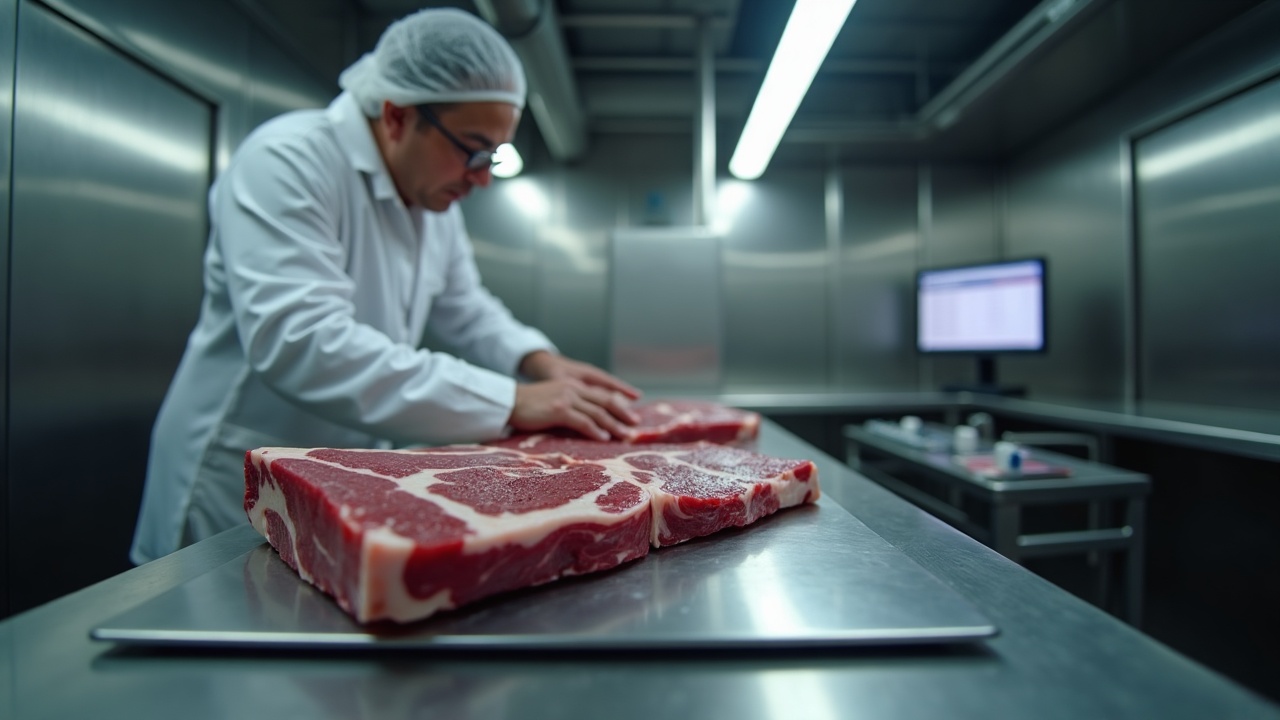
This is one of the most common and most underestimated sources of bad cost data in food manufacturing. Your bill of materials says a batch should produce 1,000 units. The floor produces 920. Your system records 1,000 units at standard cost. Your actual cost per unit just rose by 8.7 percent, and your on-hand inventory count is wrong by 80 units.
Yield variance compounds quietly. A 5 percent yield loss on a product with a 20 percent gross margin does not leave you with 15 percent. Depending on your cost structure, it can cut you to single digits or push you negative. Every batch where actual output falls short of the standard is a batch where your per-unit cost is higher than the sheet says, and you have no way to see it unless actual yield is captured and compared against the standard at the batch level.
Result: You price a SKU based on a standard yield you have not actually achieved in six months. The gap between expected and real output never surfaces because nobody is measuring it batch by batch. The product sells. The cost accumulates. The food manufacturing margin shrinks, and the cause never gets traced back to the line.
Fixing a yield problem requires seeing it first. That means capturing what the floor actually produced, not what the recipe assumed it would.
Giveaway and Overfill: Free Product You Ship on Every Case
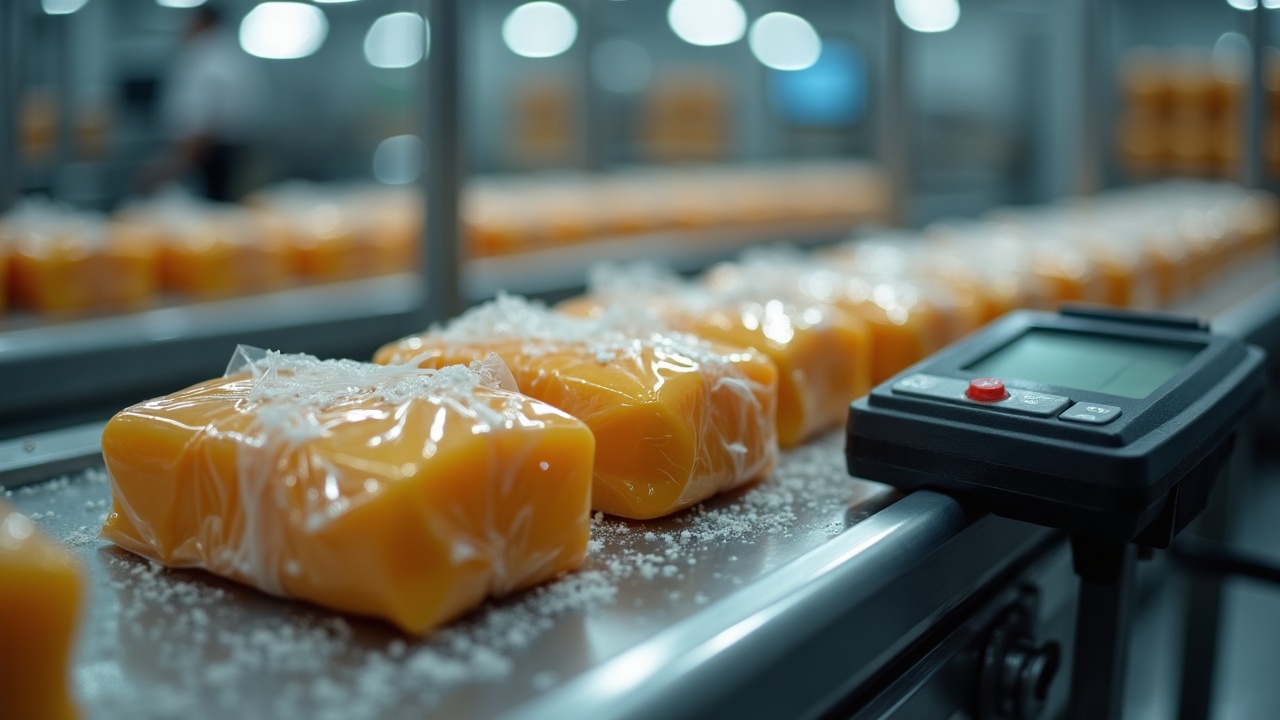
To avoid underweight violations, most filling operations run above the stated net weight. Target 100 grams, fill 103 grams. That 3 percent overfill is product you manufactured, packaged, and shipped for free. It does not show up as a line item on your cost sheet because your system assumes perfect fill. It does not show up in your price because you set the price against a cost that excludes it.
At scale, this is not a rounding error. On a high-volume line running 50,000 cases a week, a 3 percent overfill is 1,500 cases of free product shipped every seven days. That is real ingredient cost, real packaging cost, and real labor cost that evaporates with no corresponding revenue.
This is precisely where catch weight matters. When cost follows actual weight shipped rather than a fixed unit count, the overfill becomes visible. You can see what you gave away, quantify it, and decide whether a capital investment in better filling equipment pays back faster than the ongoing giveaway. Without catch weight data flowing into your cost picture, you are guessing, and the guess is always optimistic.
Pro tip: If your current system does not differentiate between a 100-gram fill and a 104-gram fill when calculating cost of goods, your product costing model is structurally incomplete for any weight-variable item.
Customer-Level Blindness: The Margin You Think You Have Versus the Margin You Keep

Invoice margin is not realized margin. The same SKU sold to two different accounts can carry very different true profitability once you account for freight terms, payment terms, returns, promotional allowances, and chargebacks.
Account A pays within 30 days, picks up at your dock, and rarely returns product. Account B demands next-day delivery, pays at 90 days, and deducts chargebacks every quarter. Your invoice shows both accounts at 25 percent gross margin. After all adjustments, Account A earns you 22 percent. Account B earns you negative 4 percent. You are paying to serve them.
Without per-customer margin visibility, you cannot make that distinction. You cannot reprice Account B, restructure the relationship, or walk away from it, because from where you sit, it looks like a 25 percent account. The damage is invisible until it shows up as an unexplained shortfall at year-end, and by then you have already renewed the contract.
This is not a pricing problem. You already have a price. What you do not have is a clear view of what you actually net after every cost associated with serving that customer is counted.
What Good Cost Visibility Actually Looks Like
The goal is not a better spreadsheet. It is operational truth, current enough to act on. That means landed cost that updates as ingredient prices move, not on a quarterly schedule. It means actual yield captured per batch so the gap between your standard and your floor is visible before it compounds across a thousand units. It means catch weight handled correctly so cost tracks actual weight shipped, not an assumed fill. And it means margin visible by SKU, by batch, and by customer, so you know this week where you are making money and where you are not.
The payoff is not a better price. The payoff is the ability to act. You might reprice one account once you see the true net. You might cut a SKU that has never actually been profitable at your real yield rate. You might call a supplier and renegotiate because you can now show exactly what their cost increase did to your margin on three specific products. You might walk away from a customer you have been subsidizing for two years without realizing it.
None of those decisions require software to make. They require information. The software’s job is to surface where you are bleeding, not to bleed for you.
CeleriTech’s EZ solutions are built specifically for how food and beverage businesses cost and produce: variable yields, catch weight items, multi-step production, and customer-level profitability all handled as core functions, not workarounds. One accountable partner configures and supports the system. You get a single source of cost truth instead of three departments carrying three different answers.
Most operators reading this already suspect their numbers are off. They have seen the signs: margins that do not match expectations, customers that feel like a grind to service, SKUs that move volume but never seem to generate cash. The suspicion is usually right. The problem is that suspicion without data does not give you anything to act on.
For more on how food manufacturers can think about ingredient cost volatility and its effect on profitability, the USDA Economic Research Service food price data and analysis from Food Dive’s manufacturing coverage offer useful context on the pressures reshaping the category. The PMMI research on packaging and production efficiency is also worth reviewing for benchmarks on overfill and giveaway across food lines.
Start With Your Actual Numbers, Not a Demo
The next step is not a product tour. It is a direct conversation about what your cost data looks like right now, where the gaps are, and which SKUs or accounts are most likely bleeding margin you cannot currently see. If you run a food or beverage operation between $5M and $75M in revenue and you are not fully confident in your per-unit cost at today’s input prices, that conversation is worth having.
Reach out to the CeleriTech team and tell us what your current costing process looks like. We will tell you where the risks are. No pressure, no pitch, just a clear look at where the numbers are likely to be wrong and what it would take to fix them.