


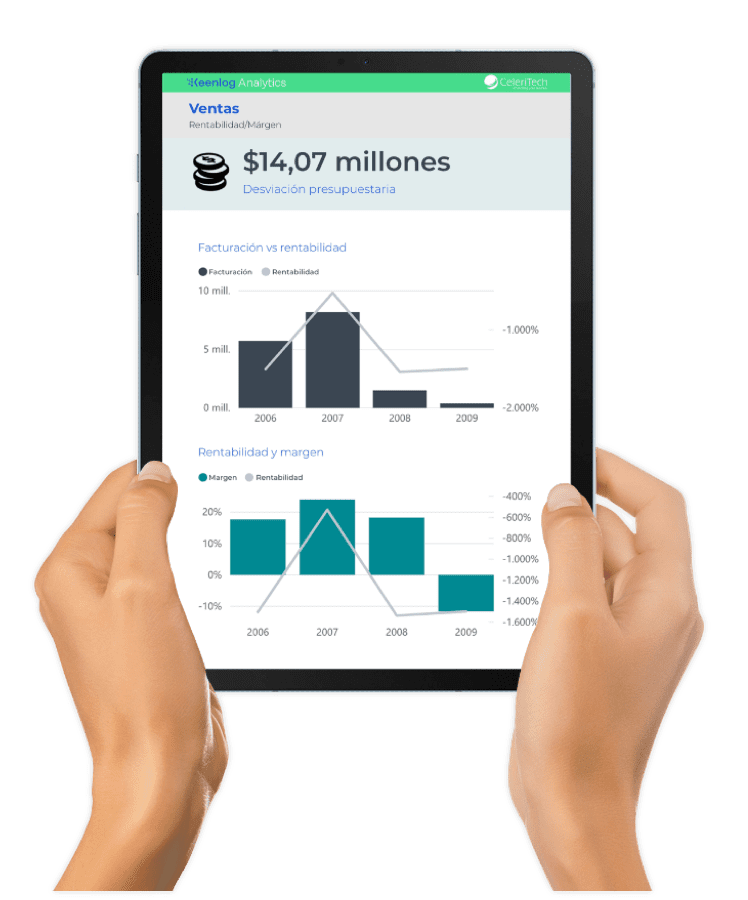
 Profitability and margin
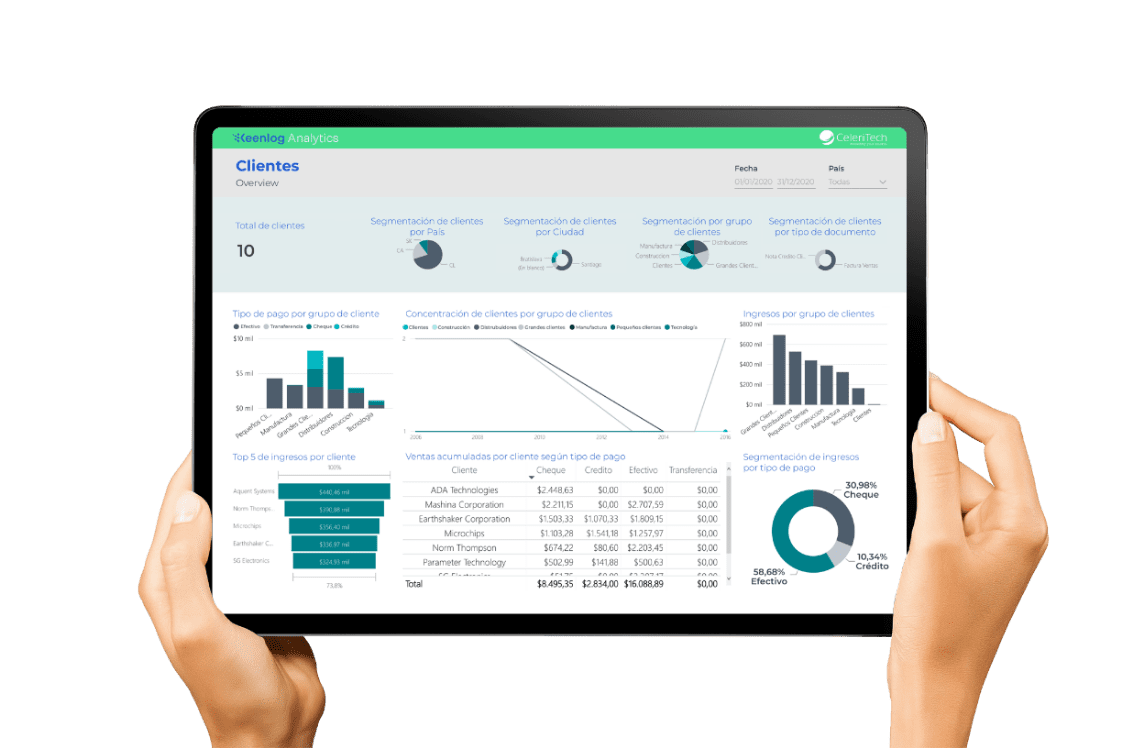
Customer behavior
Accounts receivable
Order management
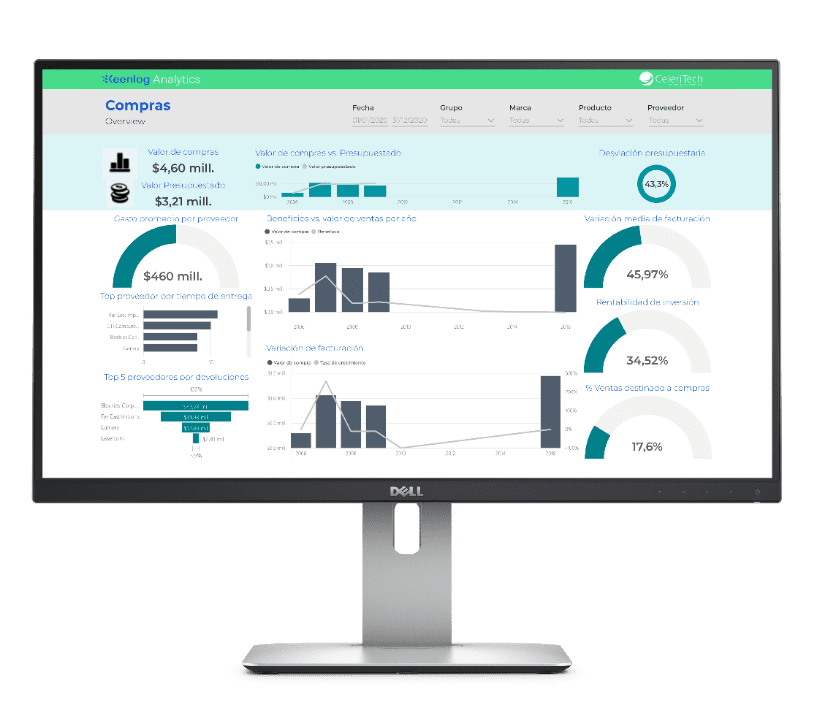
Accounts payable
Supplier data
Budget variance and investment margin
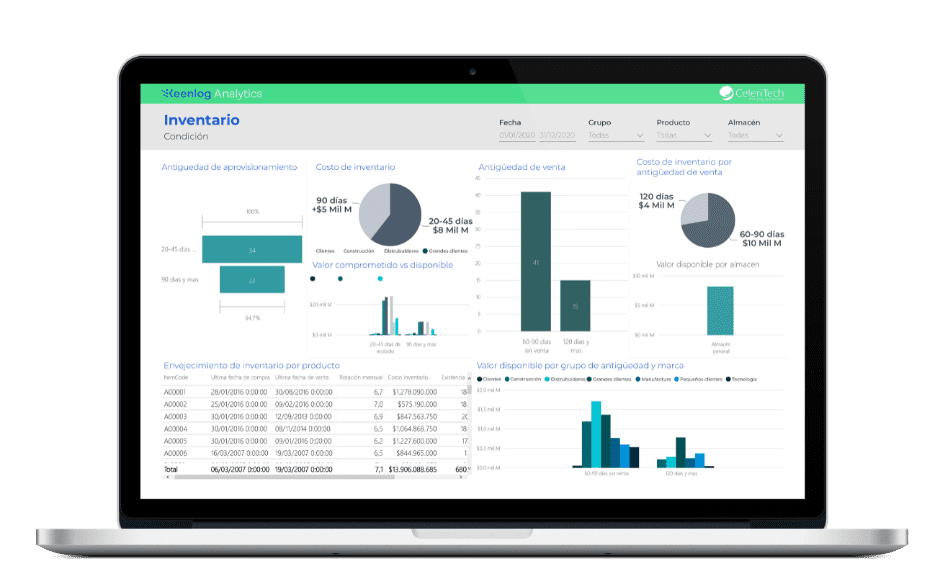
Value by product or group
Input/output flow
Inventory turnover
Situation details
Average sales cycle time
Results by stage of the Opportunity Cycle
Top sales
Stages and status of opportunities by supplier